1. Chart Style
Configuring the Basic Style of the Chart
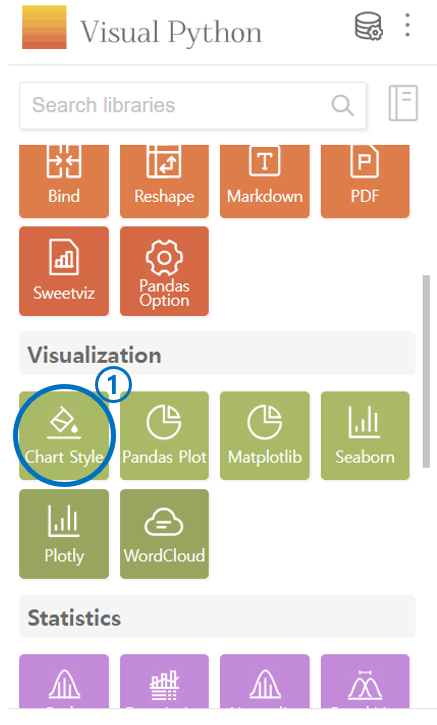
Click on the Chart Style in the visualization category.
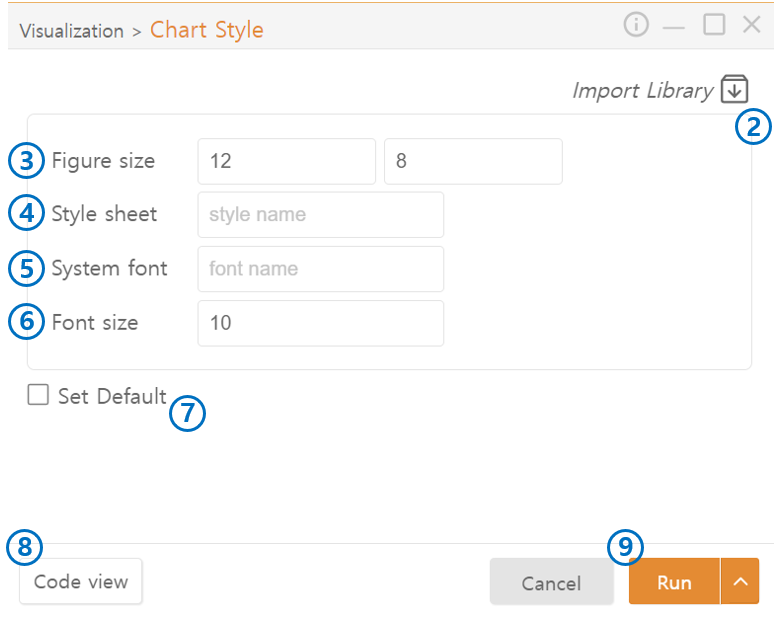
Use Import Library in the top right corner to import Matplotlib and Seaborn without specific chart style settings.
Set the figure size for the chart to be displayed.
Choose the style of the chart to be displayed.
Set the font for the text entered in the chart to be displayed.
Select the font size.
Default settings can be applied for the configuration.
Preview the code that will be generated.
Output the code.
Last updated