Visual Python Manual
CtrlK
  • Visual Python Manual
  • GETTING STARTED
    • Welcome to Visual Python
    • How to install
    • Installing FAQ
    • Official homepage
    • Link to Github
  • Data Analysis
    • 1. Import
    • 2. File
    • 3. Data Info
    • 4. Frame
      • 4-1. Frame - Edit
      • 4-2. Frame - Transform
      • 4-3. Frame - Sort
      • 4-4. Frame - Encoding
      • 4-5. Frame - Data Cleaning
    • 5. Subset
    • 6. Groupby
    • 7. Bind
    • 8. Reshape
  • Visualization
    • 1. Chart Style
    • 2. Pandas Plot
    • 3. Matplotlib
    • 4. Seaborn
    • 5. Plotly
    • 6. WordCloud
  • Statistics
    • 1. Prob. Distribution
    • 2. Descriptive Statistics
    • 3. Normality Test
    • 4. Equal Var. Test
    • 5. Correlation Analysis
    • 6. Reliability Analysis
    • 7. Chi-square Test
    • 8. Student's T-test
    • 9. ANOVA
    • 10. Factor Analysis
    • 11. Regression
    • 12. Logistic Regression
  • Machine Learning
    • 1. Data Sets
    • 2. Data Split
    • 3. Data Prep
    • 4. AutoML
    • 5. Regressor
    • 6. Classifier
    • 7. Clustering
    • 8. Dimension
    • 9. GridSearch
    • 10. Fit/Predict
    • 11. Model Info
    • 12. Evaluation
    • 13. Pipeline
    • 14. Save / Load
Powered by GitBook
On this page
  1. Machine Learning

1. Data Sets

Import or Create Sample Data

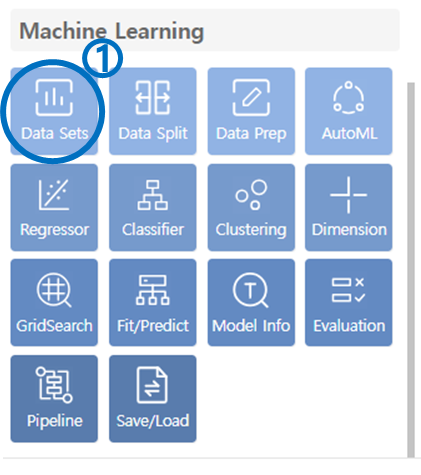
  1. Click on Data Sets in the Machine Learning category.

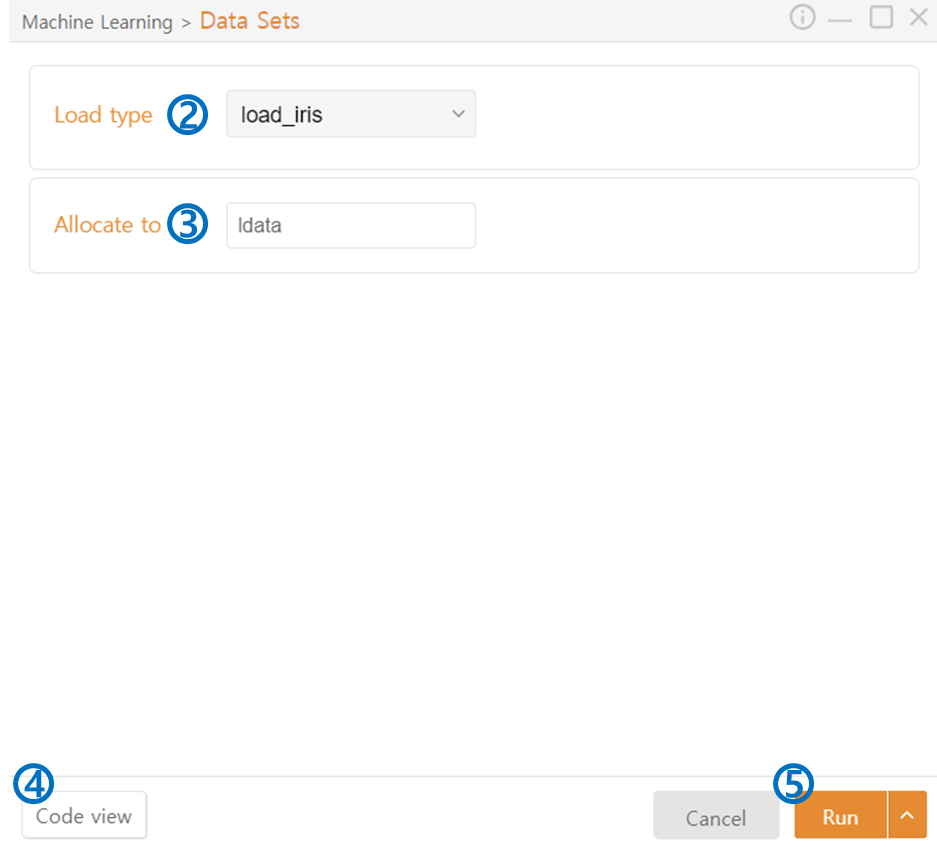
  1. Load Type: You can load sample data (Load Data) or generate data (Create Data).

  2. Allocate to: Specify variable names to assign to the data.

  3. Code View: Preview the code that will be output.

  4. Run: Execute the code.

Previous12. Logistic RegressionNext2. Data Split

Last updated 1 year ago