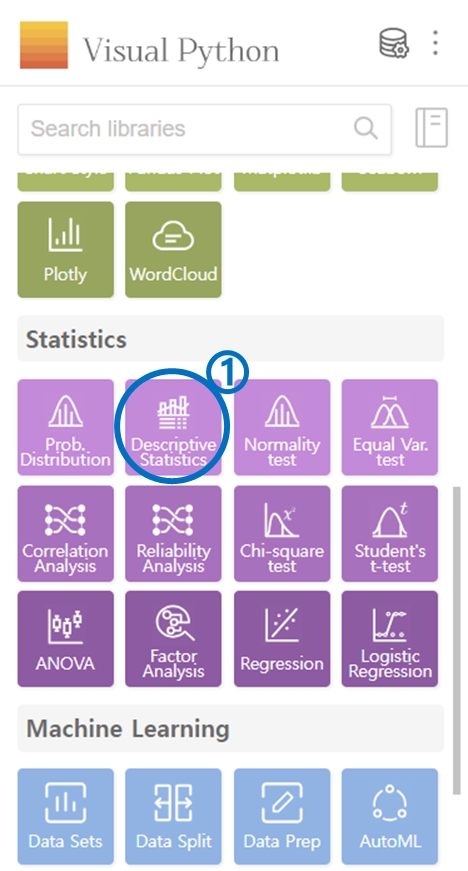
2. Descriptive Statistics
Select Descriptive Statistics in the Statistics category.
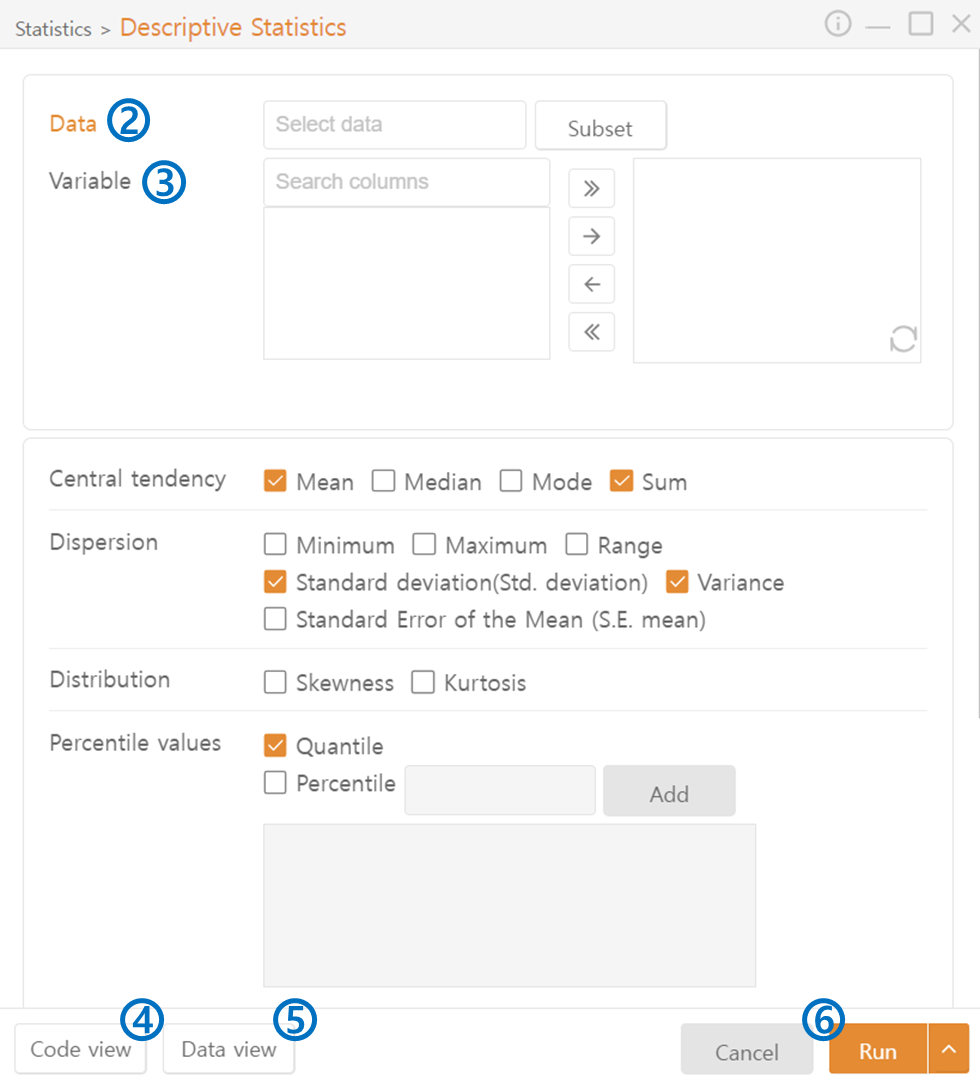
Data: Choose a DataFrame. You can apply conditions or slice through the Subset.
Variable: Select the column from the chosen DataFrame to be designated as the Variable.
Code View: Preview the code that will be displayed.
Data View: Preview the displayed results.
Run: Execute the code.
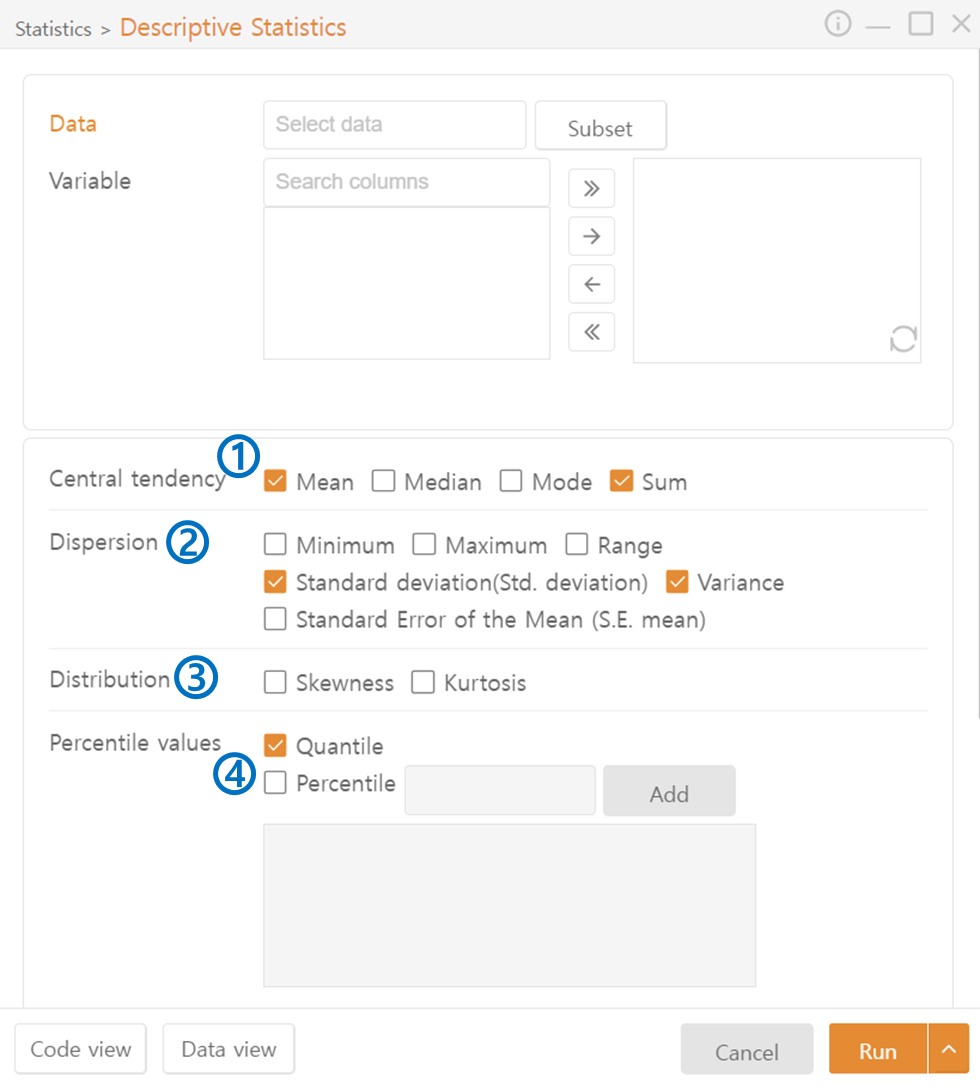
Descriptive Statistics
Central Tendency outputs the selected variable's Mean, Median, Mode, and Sum.
Dispersion outputs the Minimum, Maximum, Range, Standard Deviation, Variance, and Standard Error of the Mean of the selected variable.
Distribution outputs the Skewness and Kurtosis of the selected variable.
Percentile Values outputs Quantiles and Percentiles of the selected variable.
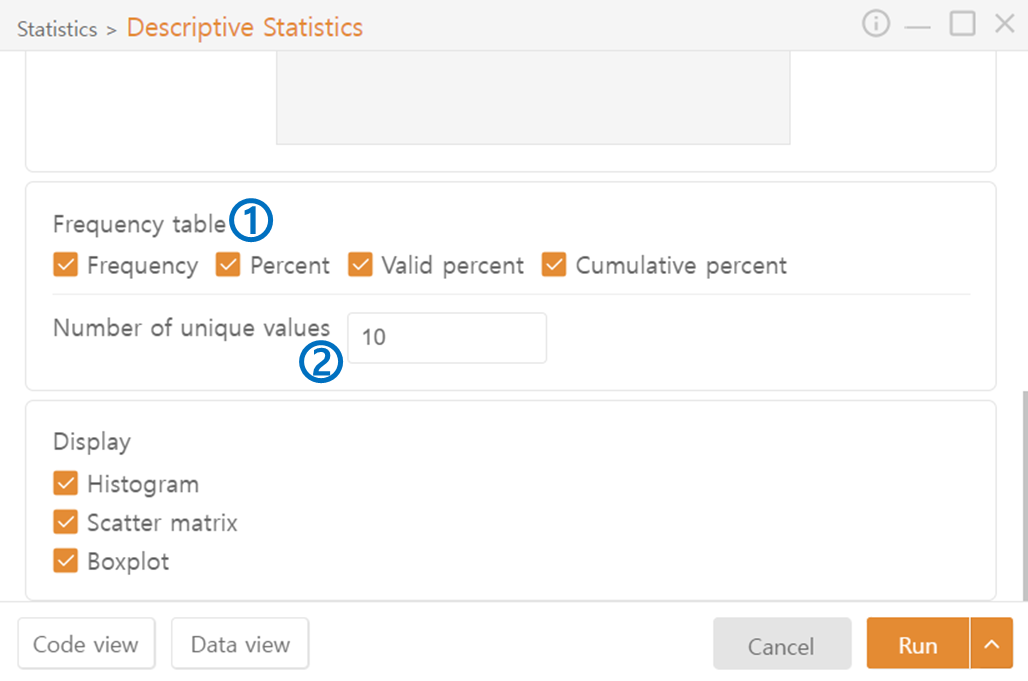
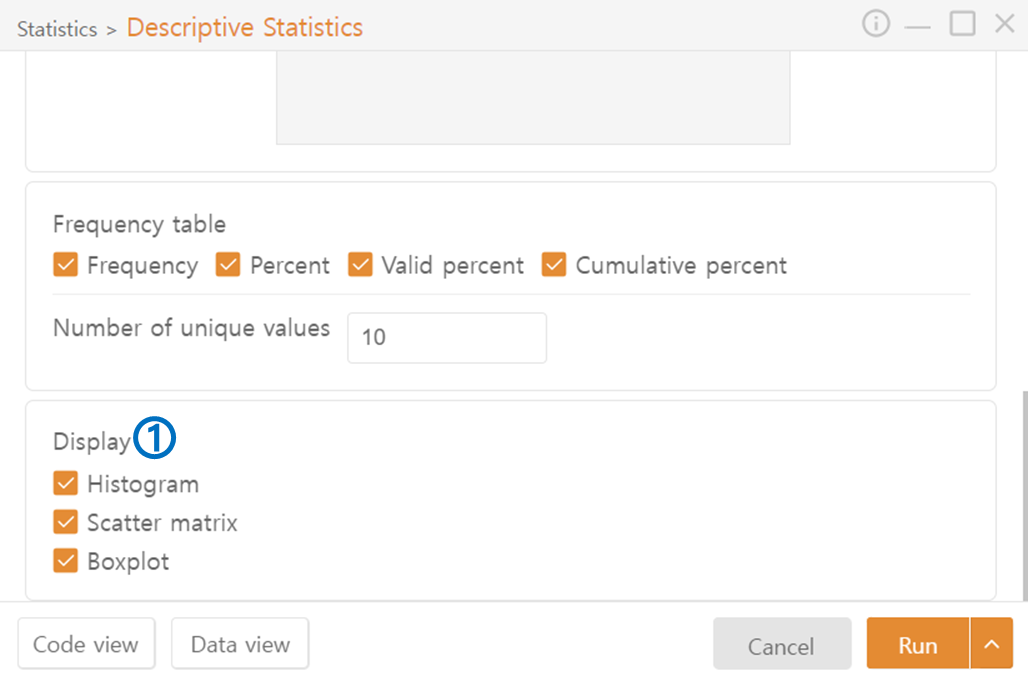
Frequency Table
It outputs Frequency, Percent, Valid Percent, and Cumulative Percent of the selected variable.
Number of Unique Values divides the data of the selected variable into units of entered values.
Display
Select the plots to be displayed.
Last updated