6. Reliability Analysis
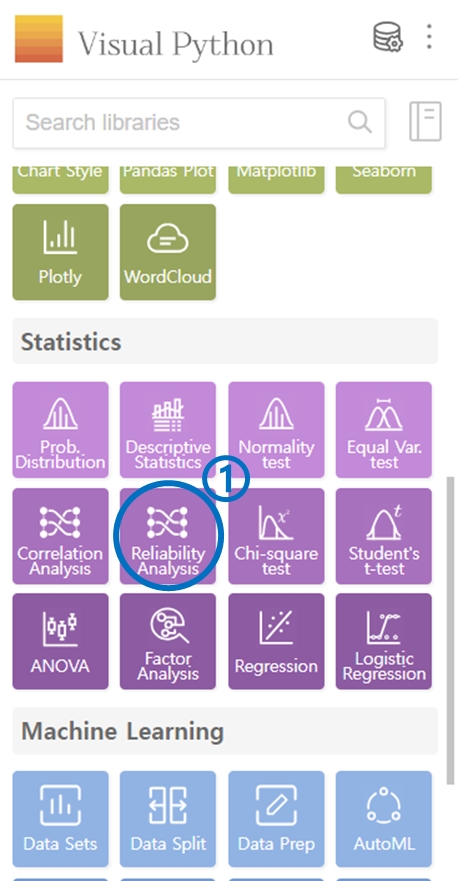
Click on Reliability Analysis in the Statistics category.
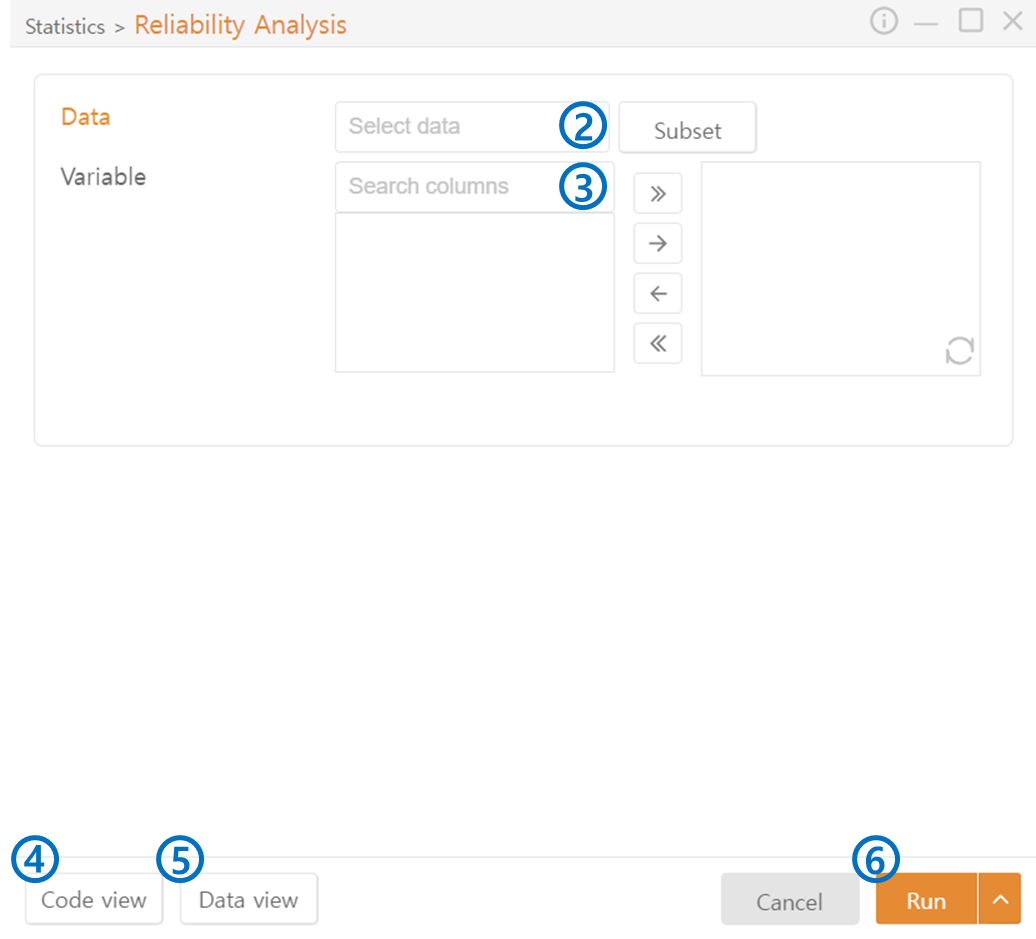
Data: Select the data for Reliability Analysis. You can specify only the data that meets specific conditions from the chosen DataFrame through Subset.
Variable: Choose the columns for Reliability Analysis from the data selected above.
Code View: Preview the code that will be generated.
Data View: Preview the data that will be output.
Run: Execute the code.
Output Example
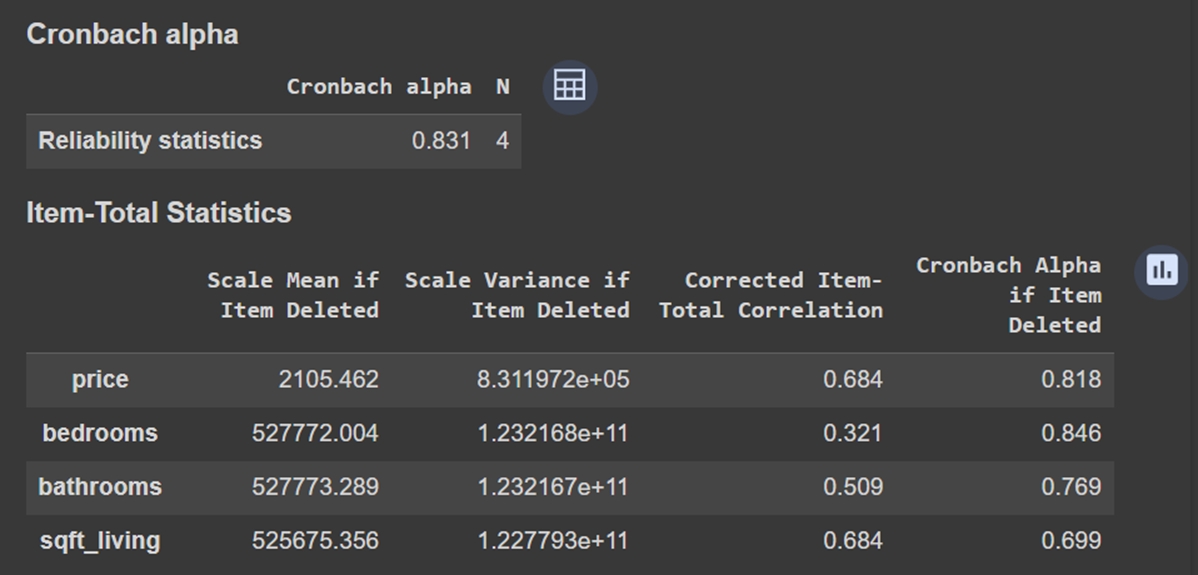
Cronbach Alpha used in Reliability Analysis is a statistical method measuring Consistency, and this consistency is an indicator of Reliability.
The Cronbach Alpha value is output between 0 and 1, where closer to 1 indicates higher consistency. The N value represents the number of columns selected.
The Item-Total Statistics table displays the mean, variance, and Cronbach Alpha values for each column's presence or absence. Additionally, Corrected Item-Total Correlation indicates how consistent each column is with the total.
Last updated