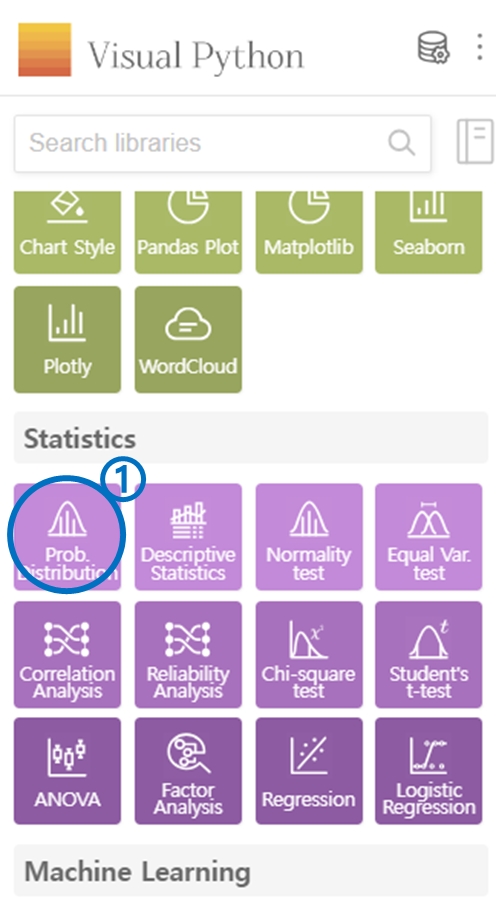
1. Prob. Distribution
Click on the Prob. Distribution icon in the Statistics category.
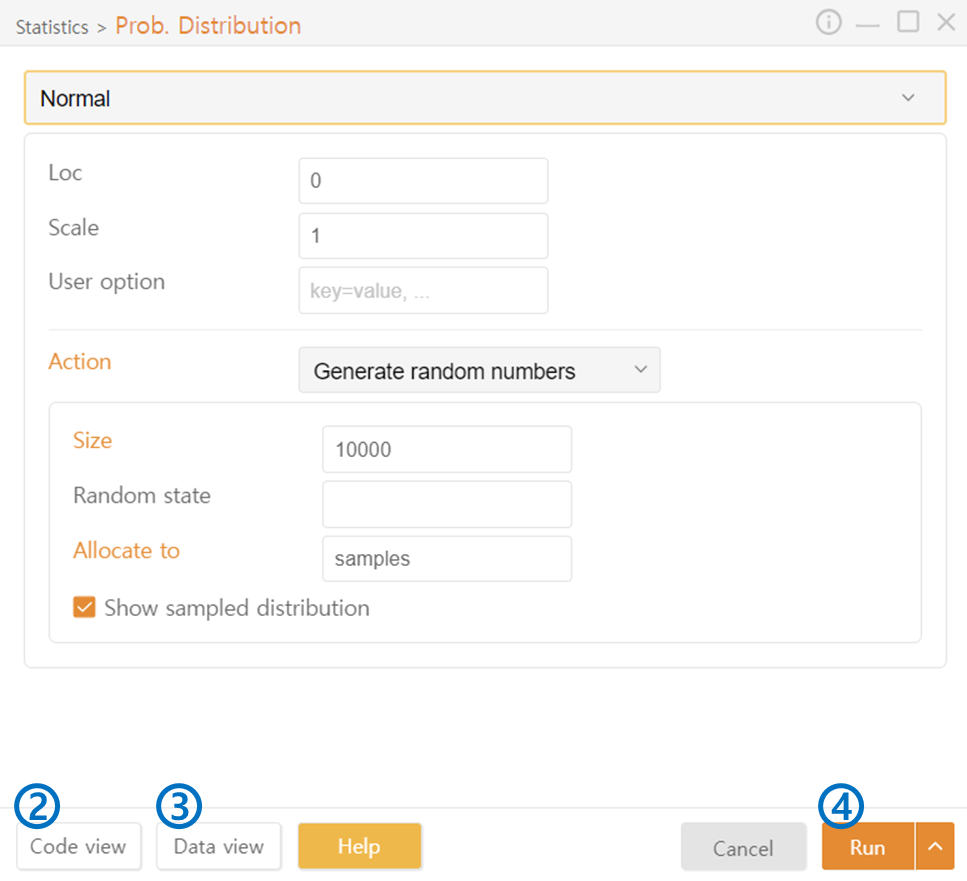
Code View: Preview the code that will be generated.
Data View: View the data used in the operation.
Run: Execute the code.
Common
Discrete Probability Distribution
Continuous Probability Distribution
Uniform
Common
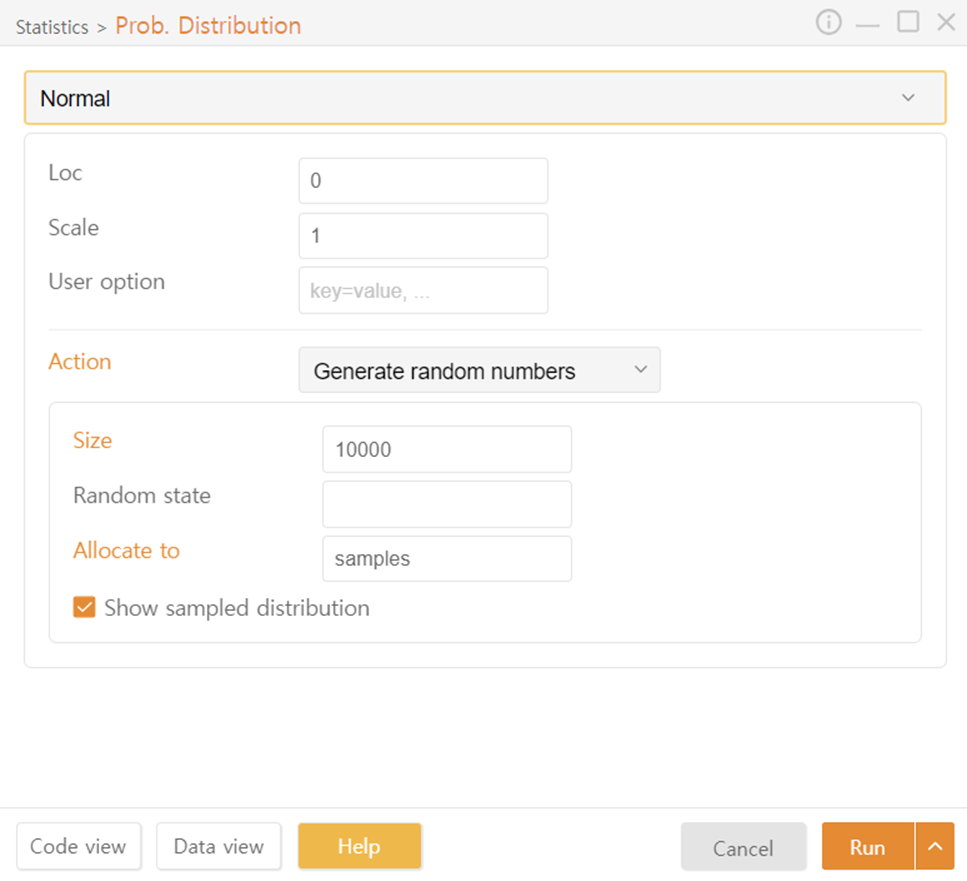
Action
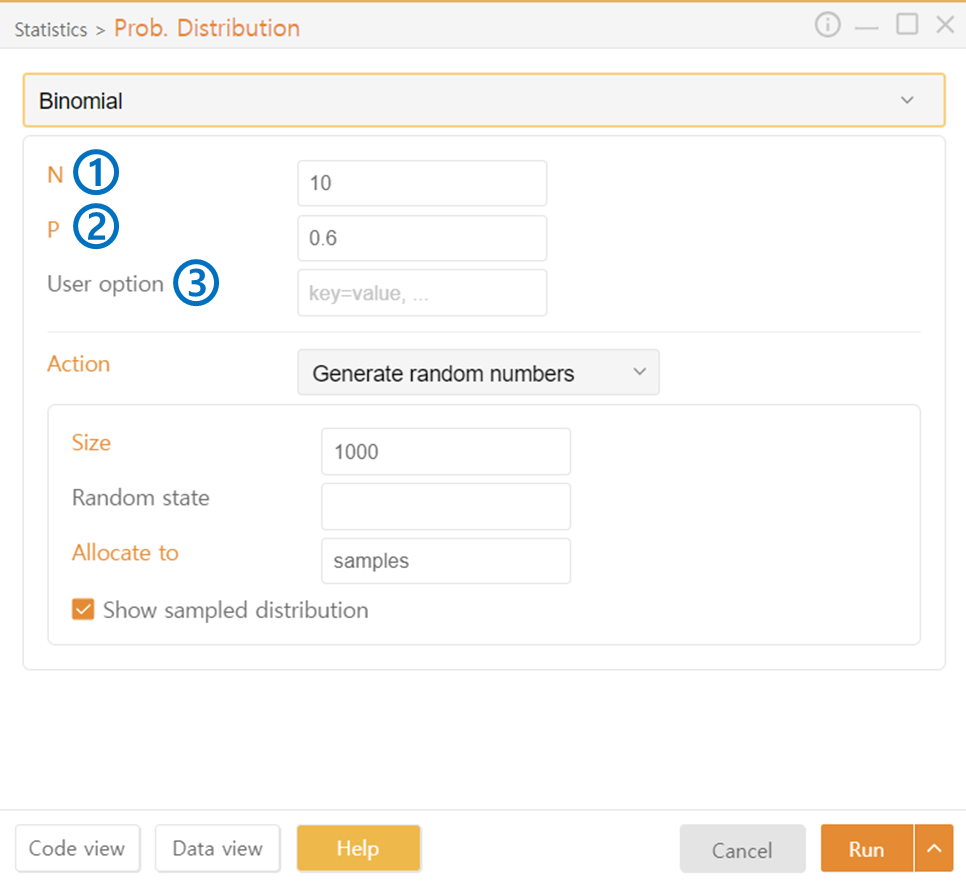
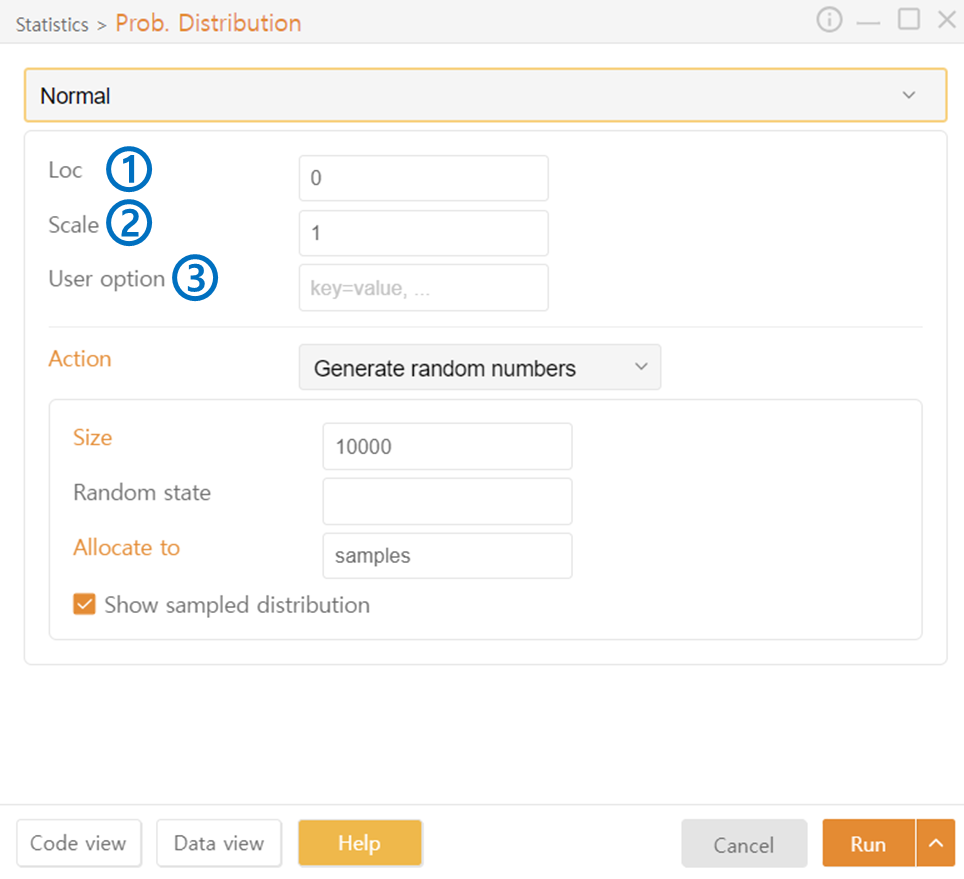
Generate Random Numbers
Size: Set the number of samples extracted from the generated distribution.
Random State: Set the seed.
Allocate to: Specify the variable (call name) toate.
Show Sampled Distribution: Visualize the distribution drawn from the samples.
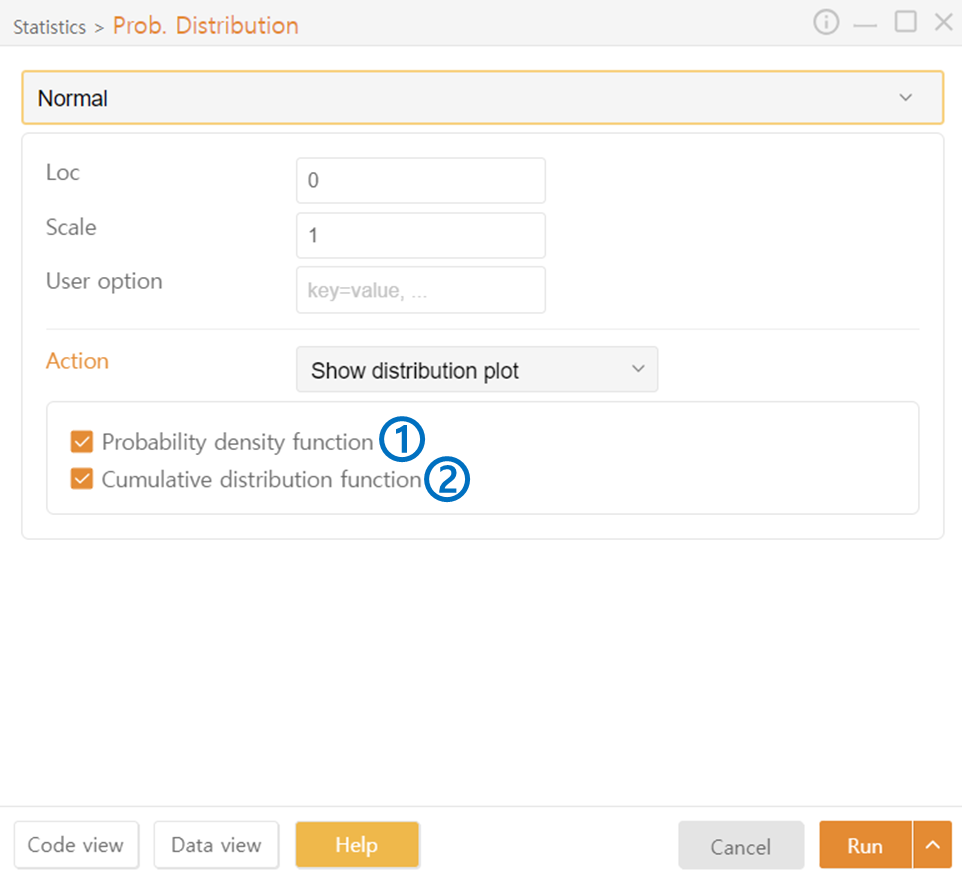
Show Distribution Plot
Probability Density Function: Output the probability density function.
Cumulative Distribution Function: Output the cumulative distribution function.
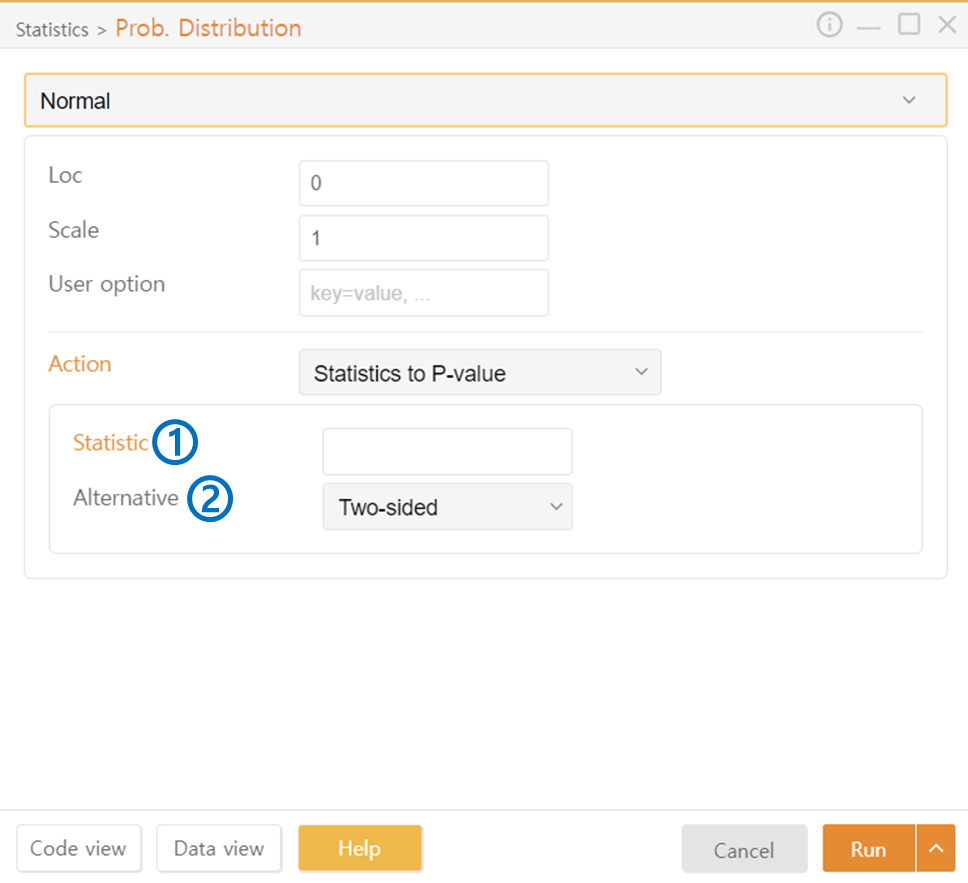
Statistics to P-Value
Statistic: You will obtain the probability of getting a value equal to or greater than the absolute value entered here in this distribution.
Alternative: Two-sided; for a two-tailed test, One-sided; for a one-tailed test.
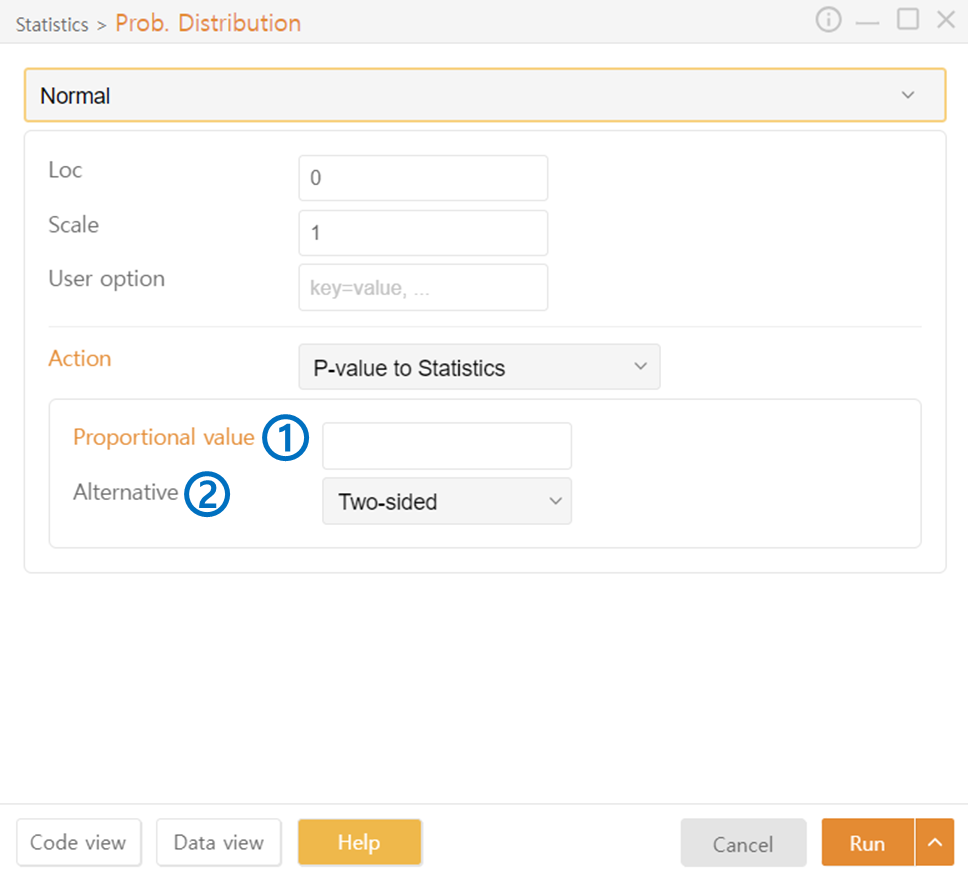
P-Value to Statistics
Proportional Value: Enter the p-value; the range on the distribution where values equal to or greater than the entered p-value will be calculated and displayed.
Alternative: Choose between two-sided or one-sided test.
Discrete Probability Distribution
Bernoulli
P: Enter the probability of getting 1 in the binary outcome of 0 and 1.
User Option: Optionally provide additional desired options.
Binomial and Multinomial
N: Enter the number of trials.
P: Enter the probability of success in a trial. Use the Funnel Icon to fetch values entered in a specific dataframe column. (The form of the input values can be referred to in the generated examples.)
Continuous Probability Distribution
Normal
Loc: Set the mean of the normal distribution.
Scale: Set the standard deviation of the normal distribution.
User Option: Optionally provide additional desired options.
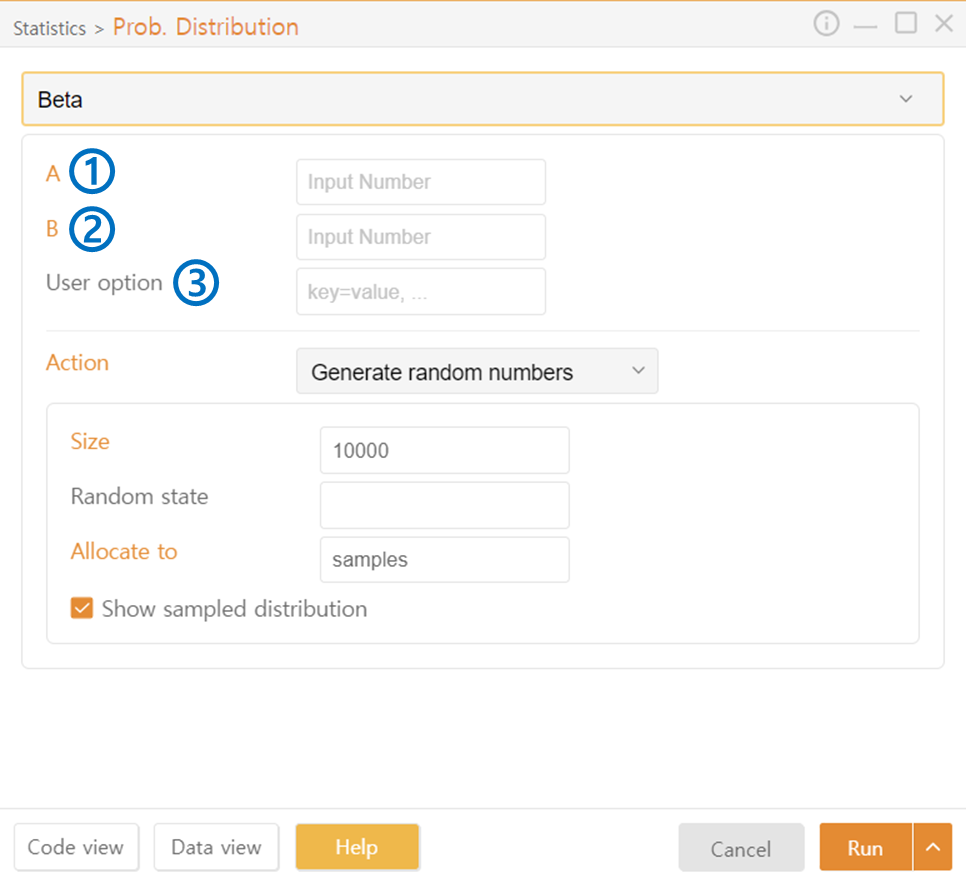
Beta
A: Set the shape parameter a of the beta distribution.
B: Set the shape parameter b of the beta distribution.
User Option: Optionally provide additional desired options.
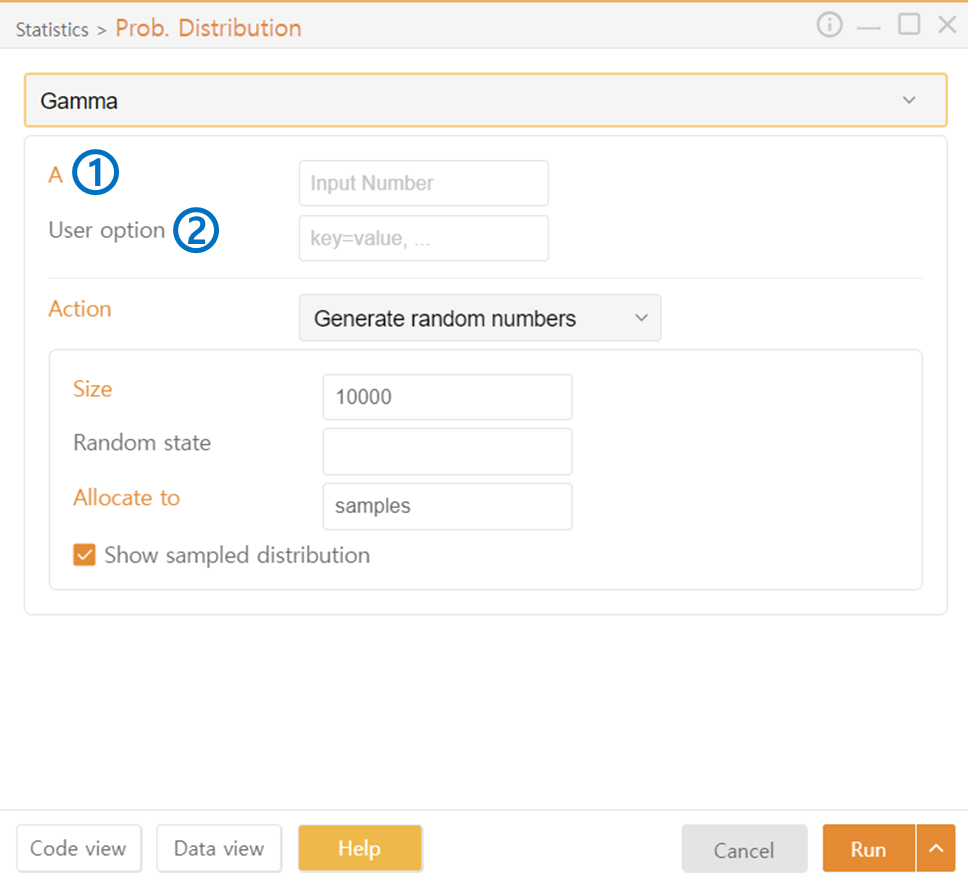
Gamma
A: Set the shape parameter of the gamma distribution.
User Option: Optionally provide additional desired options.
Student's t and Chi2
Df: Set the degrees of freedom for the t-distribution or chi-squared distribution.
User Option: Optionally provide additional desired options.
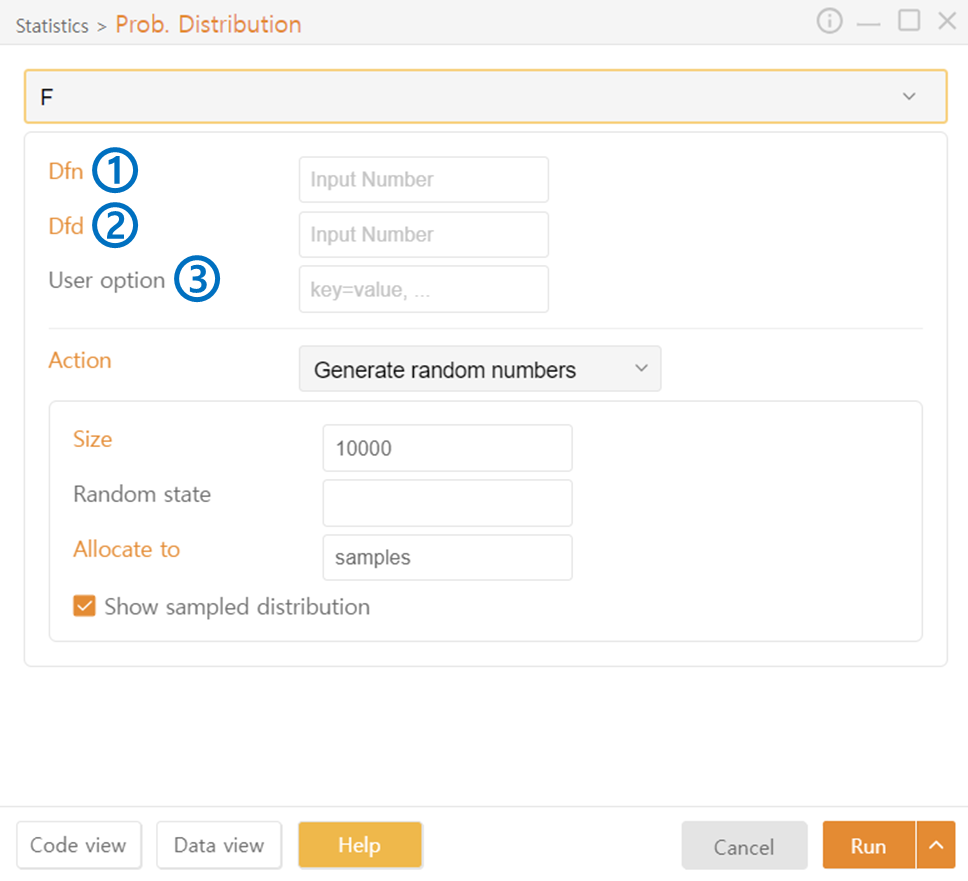
F
Dfn: Set the numerator degrees of freedom.
Dfd: Set the denominator degrees of freedom.
The F-distribution represents the ratio of two chi-squared distributions. Dfn and Dfd are the degrees of freedom for the two chi-squared distributions.
User Option: Optionally provide additional desired options.
Dirichlet
Alpha: Enter the importance for three categories (or dimensions) in the format (a, b, c).
Seed: If provided, the generated random numbers will be fixed.
User Option: Optionally provide additional desired options.
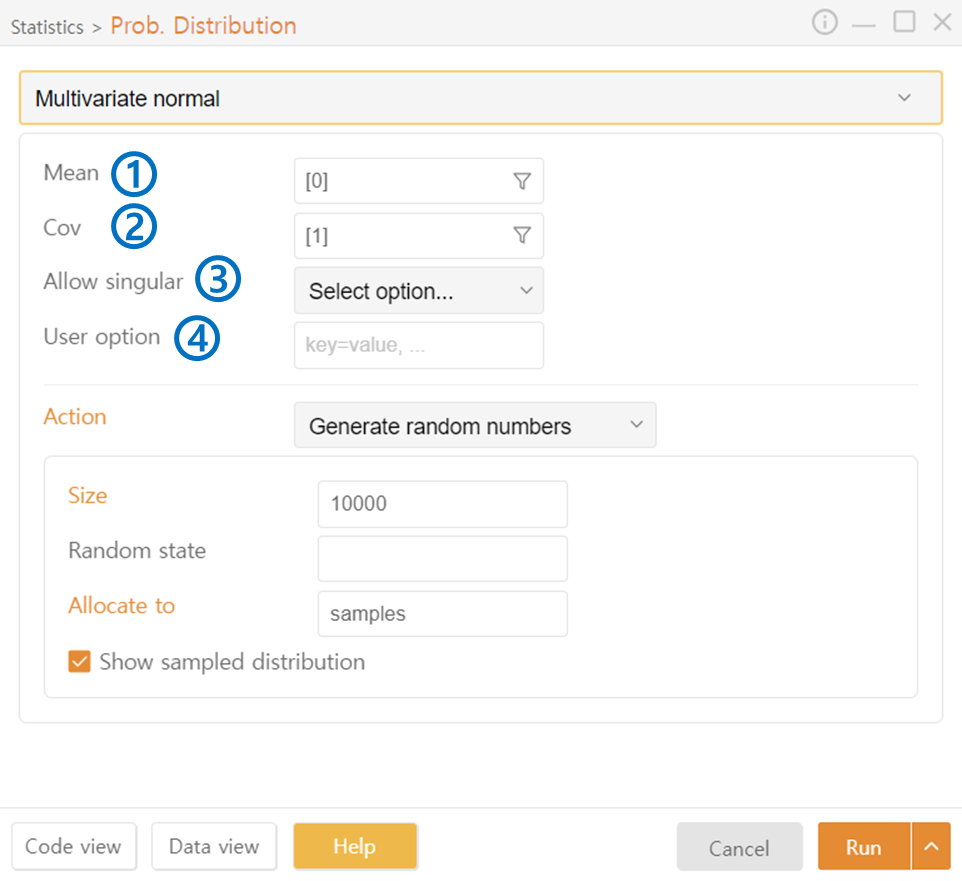
Multivariate Normal
Mean: Set the mean of the distribution. For [a, b], the mean of the first distribution is a, and the mean of the second distribution is b.
Cov: Set the covariance of the distribution. For [a, b], the covariance of the first distribution is a, and the covariance of the second distribution is b.
Allow Singular: If True, allows generating the distribution even when the covariance matrix is singular.
User Option: Optionally provide additional desired options.
Last updated