Visual Python Manual
  • Visual Python Manual
  • GETTING STARTED
    • Welcome to Visual Python
    • How to install
    • Installing FAQ
    • Official homepage
    • Link to Github
  • Data Analysis
    • 1. Import
    • 2. File
    • 3. Data Info
    • 4. Frame
      • 4-1. Frame - Edit
      • 4-2. Frame - Transform
      • 4-3. Frame - Sort
      • 4-4. Frame - Encoding
      • 4-5. Frame - Data Cleaning
    • 5. Subset
    • 6. Groupby
    • 7. Bind
    • 8. Reshape
  • Visualization
    • 1. Chart Style
    • 2. Pandas Plot
    • 3. Matplotlib
    • 4. Seaborn
    • 5. Plotly
    • 6. WordCloud
  • Statistics
    • 1. Prob. Distribution
    • 2. Descriptive Statistics
    • 3. Normality Test
    • 4. Equal Var. Test
    • 5. Correlation Analysis
    • 6. Reliability Analysis
    • 7. Chi-square Test
    • 8. Student's T-test
    • 9. ANOVA
    • 10. Factor Analysis
    • 11. Regression
    • 12. Logistic Regression
  • Machine Learning
    • 1. Data Sets
    • 2. Data Split
    • 3. Data Prep
    • 4. AutoML
    • 5. Regressor
    • 6. Classifier
    • 7. Clustering
    • 8. Dimension
    • 9. GridSearch
    • 10. Fit/Predict
    • 11. Model Info
    • 12. Evaluation
    • 13. Pipeline
    • 14. Save / Load
Powered by GitBook
On this page
  1. GETTING STARTED

Welcome to Visual Python

PreviousVisual Python ManualNextHow to install

Last updated 1 year ago

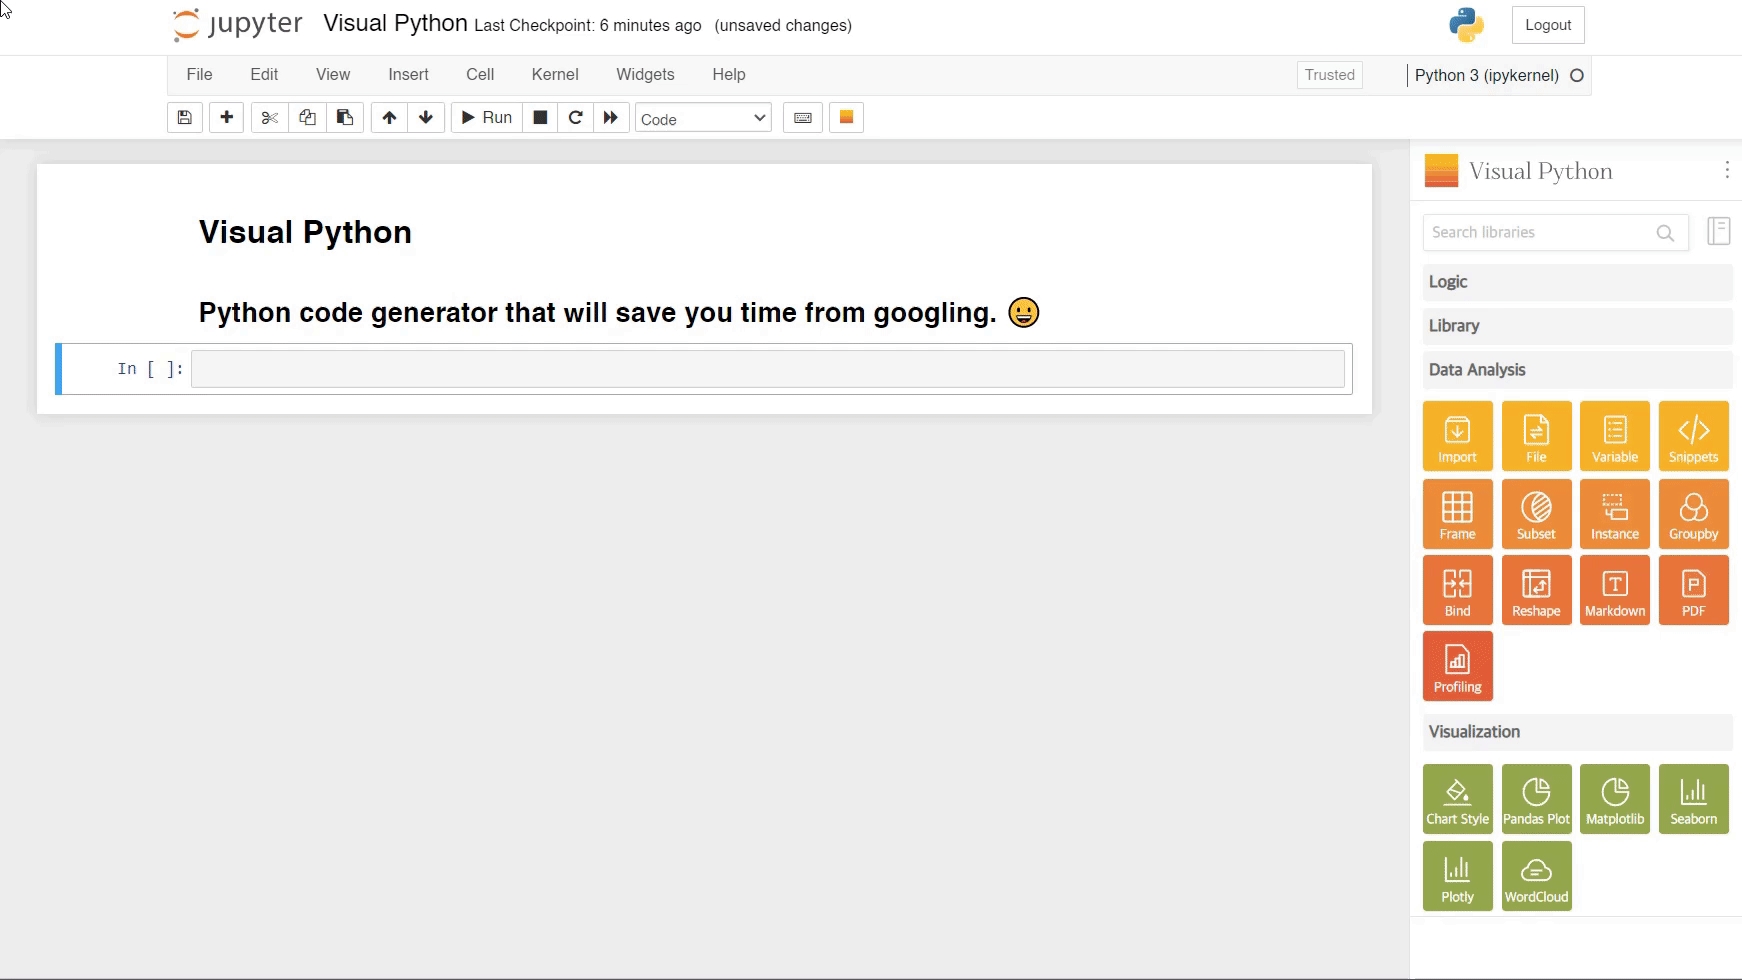
Visual Python is a GUI-based Python code generator for data science.

Visual Python is an extension to Jupyter Lab, Jupyter Notebook and Google Colab.

Visual Python is an open source project started for students who struggle with coding during Python classes for data science.

Try Visual Python if you would like to

  • manage big data with minimal coding skills.

  • help students / business analysts / researchers to overcome learning barriers for Python.

  • save & reuse repeatedly used codes(snippets).

Visual Python 2.2.8 demo