Visual Python Manual
  • Visual Python Manual
  • GETTING STARTED
    • Welcome to Visual Python
    • How to install
    • Installing FAQ
    • Official homepage
    • Link to Github
  • Data Analysis
    • 1. Import
    • 2. File
    • 3. Data Info
    • 4. Frame
      • 4-1. Frame - Edit
      • 4-2. Frame - Transform
      • 4-3. Frame - Sort
      • 4-4. Frame - Encoding
      • 4-5. Frame - Data Cleaning
    • 5. Subset
    • 6. Groupby
    • 7. Bind
    • 8. Reshape
  • Visualization
    • 1. Chart Style
    • 2. Pandas Plot
    • 3. Matplotlib
    • 4. Seaborn
    • 5. Plotly
    • 6. WordCloud
  • Statistics
    • 1. Prob. Distribution
    • 2. Descriptive Statistics
    • 3. Normality Test
    • 4. Equal Var. Test
    • 5. Correlation Analysis
    • 6. Reliability Analysis
    • 7. Chi-square Test
    • 8. Student's T-test
    • 9. ANOVA
    • 10. Factor Analysis
    • 11. Regression
    • 12. Logistic Regression
  • Machine Learning
    • 1. Data Sets
    • 2. Data Split
    • 3. Data Prep
    • 4. AutoML
    • 5. Regressor
    • 6. Classifier
    • 7. Clustering
    • 8. Dimension
    • 9. GridSearch
    • 10. Fit/Predict
    • 11. Model Info
    • 12. Evaluation
    • 13. Pipeline
    • 14. Save / Load
Powered by GitBook
On this page
  • Encoding
  • Scaling
  • ETC(SimpleImputer / SMOTE / MakeColumnTransformer)
  1. Machine Learning

3. Data Prep

Tools for Preprocessing(Encoding/Scaling)

Previous2. Data SplitNext4. AutoML

Last updated 10 months ago

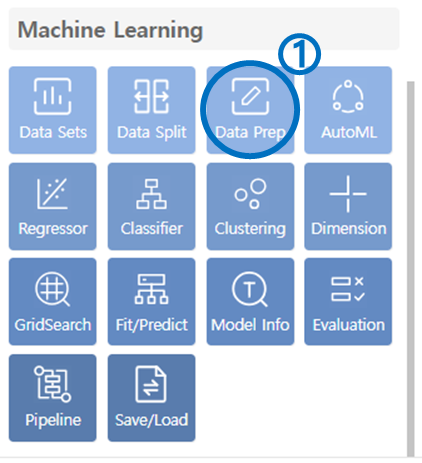
  1. Click on Data Prep in the Machine Learning category.

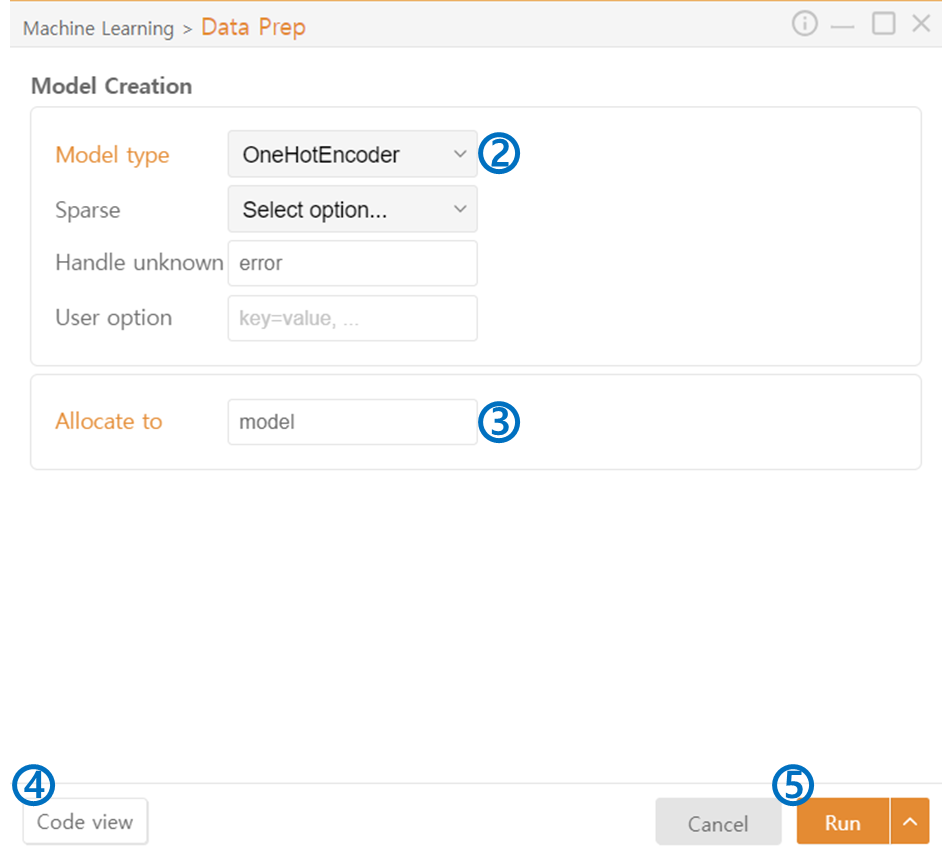
  1. Model Type: You can perform various preprocessing tasks:

  2. Allocate to: Assign variable names for the model to perform the selected preprocessing tasks.

  3. Code View: Preview the code that will be output.

  4. Run: Execute the code.


Encoding

  1. Sparse (OneHotEncoder): If true, returns the encoding result as a sparse matrix.

  2. Handle unknown (OneHotEncoder, OrdinalEncoder): Used when encoding, if there is a category that exists in the training data but not in the test data. If ignore is selected, it will be set to 0, and if error is selected, a ValueError will be raised.

  3. Unknown values (OrdinalEncoder): Fill with a specific value, not ignore or error.

  4. Cols (TargetEncoder): Select the columns to encode.

  5. Handle missing (TargetEncoder): Choose how to handle missing values.

  6. Smoothing (TargetEncoder): When the number of data in a particular category is small, it adds the entered values and calculates the average of the categories to prevent overfitting.


Scaling

  1. With mean (StandardScaler): Center the mean of the data to zero.

  2. With std (StandardScaler): Scale the standard deviation of the data to 1.

  3. With centering (RobustScaler): Performs centering by Q-subtracting the median from each attribute (column).

  4. With scaling (RobustScaler): Scales each attribute by dividing it by its IQR.

  5. Feature range (MinMaxScaler): Sets the minimum and maximum values for the scaled result.

  6. Norm (Normalizer):

    1. L1: The sum of the absolute values of each attribute will be 1.

    2. L2: Scale the vectors so that their Euclidean distance is 1.

    3. Max Norm: Ensures that the scaling result does not exceed an existing maximum value.

  7. N bins (KBins Discretizer): Determines how many bins to divide the variable into.

  8. Strategy (KBins Discretizer):

    1. uniform: Divide the section by a uniform width.

    2. QUANTILE: Divide so that each bin has an even number of data.

  9. Encode (KBins Discretizer): Specify the encoding method.

    1. ordinal: Encodes each interval as an integer.

    2. onehot: Encodes each interval as a binary vector.


ETC(SimpleImputer / SMOTE / MakeColumnTransformer)

  1. Missing values (SimpleImputer): Treats the entered values as missing.

  2. Fill value (SimpleImputer): Replaces the missing value with the input value.

  3. Copy (SimpleImputer): Returns the original data unchanged, as new data.

  4. Add indicator (SimpleImputer): Adds a new column with 0s and 1s, with a 1 for rows with missing values and a 0 for rows without.

  5. K neighbors (SMOTE): Specifies the number of neighbors to group together based on center point data.

  6. Sampling strategy (SMOTE):

    1. auto: Automatically adjusts the ratio of minority to majority class data to balance out class imbalances.

    2. minority: Makes the size of the minority class dataset equal to the size of the majority class dataset.

    3. float: You can specify the desired class ratio. For example, setting it to 0.5 makes the minority class dataset half the size of the majority class dataset.

  7. Estimator (MakeColumnTransformer): You can specify different global models to apply to each column. The model selected here will be applied to the columns selected in Columns below.

Encoding
Scaling
ETC